 Eduardo Sifuentes
The Big Story: Big Tech’s AI Debt Problem Triggers Mass Rotation
A dramatic structural shift rattled financial markets on Friday, October 16, 2026. Wall Street’s most revered tech darlings experienced another brutal wave of liquidations, pushing the tech-heavy Nasdaq Composite down 2.1% and dragging the S&P 500 lower by 1.1%. Over $1.2 trillion in market capitalization has vanished from hyper-growth artificial intelligence and semiconductor equities over the past five trading sessions.
The catalyst? A lethal cocktail of hotter-than-expected Producer Price Index (PPI) inflation figures, surging 10-year Treasury yields hovering near 5.10%, and mounting balance sheet panic regarding the staggering debt burden used to finance AI infrastructure. Even after Nvidia CEO Jensen Huang attempted to reassure credit markets by asserting that specialized cloud provider CoreWeave’s financial health remains solvent without emergency backstops, CoreWeave fell another 5.6% today. Memory and equipment heavyweights like Micron (MU) fell 4.07%, KLA Corp (KLAC) plunged 3.27%, and the PHLX Semiconductor Index extended its catastrophic losing streak to seven consecutive sessions.
Meanwhile, smart money is executing a violent capital reallocation. Defensive staples—led by Walmart (WMT), Berkshire Hathaway (BRK.B), and high-yield telecoms like AT&T (T)—saw aggressive institutional inflows. Investors are demanding immediate, tangible free cash flow rather than multi-year promises of generative AI monetizations.
Market Analysis & Chart Diagnostics
Intraday Price Action & Asset Class Divergence
The tape on October 16, 2026, provided an unambiguous picture of portfolio de-risking. While mega-cap technology experienced systematic institutional distribution, defensive and value sectors served as capital havens.
Equity & Volatility Diagnostic
The structural dynamic driving this selloff stems from a fundamental mismatch in capital efficiency. Hyperscalers have poured hundreds of billions into custom silicon, server farms, and specialized GPU clusters financed through complex debt structures. However, capital expenditure growth rates (currently expanding at +42% YoY across Big Tech) are compounding vastly faster than top-line AI revenues (+11% YoY annualized across enterprise software integration).
Asset Class Trajectory & Target Price Projections (Daily / Weekly / Monthly)
---------------------------------------------------------------------------------------
Ticker   Current    1-Day Support   1-Week Pivot   1-Month Fair Value   Algo Outlook
---------------------------------------------------------------------------------------
NVDA     $132.50       $128.00        $140.00           $115.00         Bearish Distribution
MU       $893.40       $870.00        $930.00           $780.00         Severe Volatility
KLAC     $215.10       $205.00        $229.00           $185.00         Downside Risk
WMT      $104.20       $102.50        $101.00           $112.00         Bullish Outperformance
---------------------------------------------------------------------------------------
From a chart structure perspective, the S&P 500 is currently testing its critical 50-day simple moving average at 7,706. A decisive daily close below this line will trigger secondary systematic sell programs, targeting the 200-day SMA located at 7,340.
Quantitative & Algorithmic Analysis
Basic Level: Algorithmic Feedback Loops and Liquidity Vacuum
For non-quant investors, the market action observed today can be understood as an automated domino effect. Modern financial markets are dominated by Quantitative Trading programs and Systematic Trend-Following Funds (CTAs) that do not evaluate balance sheets or earnings reports. Instead, they execute trades purely based on mathematical triggers, momentum indicators, and risk limits.
When large tech stocks like Nvidia, Micron, and KLA Corp drop past predetermined price thresholds, institutional risk algorithms automatically issue market orders to sell shares. This dumping floods order books with supply. Because high-frequency market makers simultaneously pull back their liquidity bids to protect their own capital during high volatility, market liquidity evaporates. Consequently, even small sell orders pull share prices down violently, triggering additional automated stop-loss orders in a self-reinforcing downward loop.
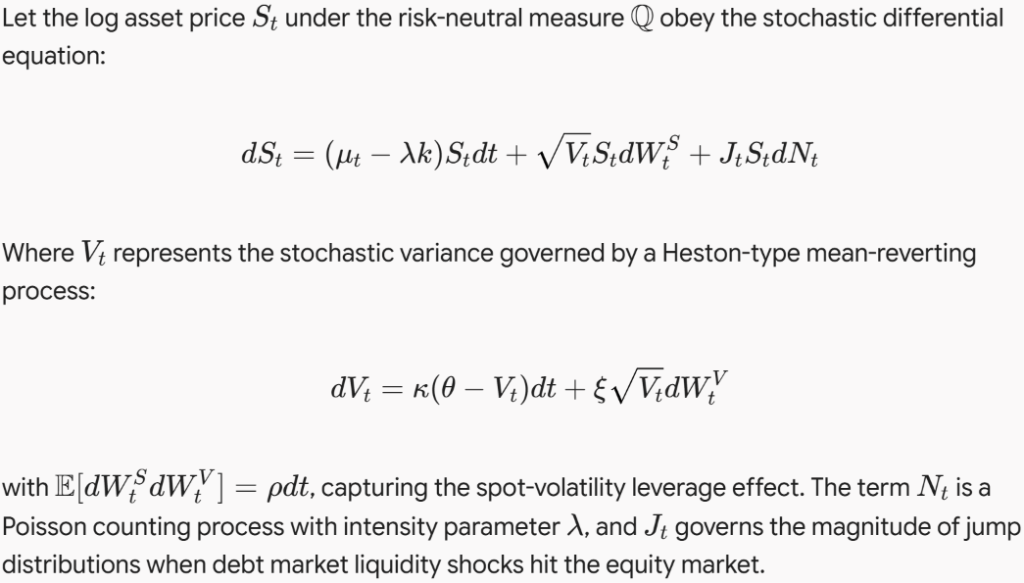
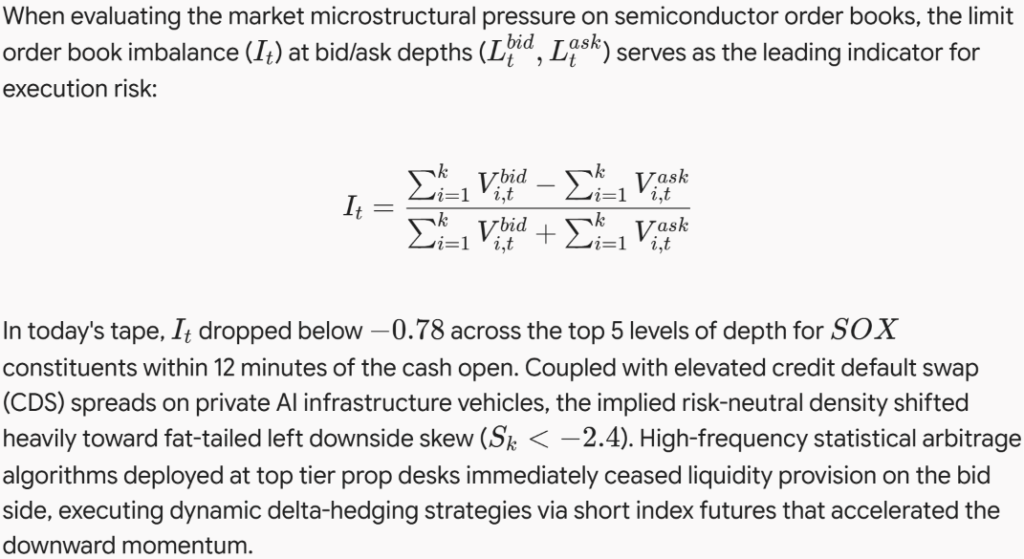
Advanced Level: Stochastic Volatility, Macro Regime Switching & Order Book Microstructure
From an advanced quantitative research framework, the ongoing market regime shift can be rigorously modeled using a continuous-time jump-diffusion process for asset prices combined with a Markov-switching model for macro volatility states.
The Contrarian View: Cutting Through the Market Noise
Looking at today’s market action, it is impossible not to feel a sense of profound clarity mixed with mild amusement. For two years, Wall Street has behaved like an eager undergraduate who stumbled into a macroeconomics seminar, completely intoxicated by the buzzword “Artificial Intelligence.”
Let us speak with absolute intellectual honesty: the structural madness we are witnessing in late 2026 was utterly inevitable. Equity valuations do not transcend the laws of corporate finance, no matter how impressive your large language model performs. When private infrastructure operators borrow hundreds of billions at floating yields near 8% to purchase hardware with a 36-month depreciation horizon, you are not engaging in visionary corporate strategy—you are running a highly leveraged carry trade masquerading as technological progress.
It is breathtaking to observe hedge fund managers on CNBC expressing shock over a hot PPI print and 5.10% Treasury yields. What did they expect? Capital is no longer free. The era of zero-interest rate quantitative euphoria is dead. Seeing capital flow out of unprofitable AI infrastructure into high-yielding, unglamorous cash machines like telecommunications and consumer staples is not a sign of financial doom; it is market rationality restoring balance to an overinflated asset bubble.
Macro Strategic Outlook: Portfolio Positioning & Asset Allocation
From a senior portfolio management perspective, today’s market environment demands cold, calculated precision rather than panic. The current drawdown in mega-cap technology is a long-overdue pricing correction driven by capital expenditure discipline and credit re-rating.
Institutional investors must recognize that the primary headwind is no longer equity valuation multiples alone; it is balance sheet duration risk. As 10-year Treasury yields consolidate above 5.00%, the discount rate applied to far-dated terminal cash flows increases dramatically. Companies whose earnings expectations are backloaded into 2028 and beyond will suffer continued multiple compression.
Conversely, balance sheets with robust current free-cash-flow yields ($>6.5\%$) and minimal refinancing exposure over the next 24 months will continue to attract premium valuations. The proper allocation strategy here is not to aggressively “buy the dip” on high-beta semiconductor names blindly, but rather to construct cash-flow-neutral pairs trades: going long high-margin, defensive dividend growers while shorting over-leveraged tech infrastructure proxies.
Senior Quant & Balance Sheet Diagnostic: Deep Capital Mechanics
Analyzing the structural mechanics of the current macro landscape reveals that Wall Street is undergoing a classic credit-induced re-pricing cycle. Over the past 18 months, non-bank financial intermediaries and private credit funds extended unprecedented debt facilities to data center operators, cloud providers, and specialized chip hosting entities. Many of these debt packages relied on equity valuation backstops that assumed perpetual 30%+ revenue growth trajectories.
Now, as enterprise spending encounters macro friction and software revenue conversion lags hardware deployment, credit markets are asserting their supremacy over equity sentiment. When private credit spreads widen, equity downside volatility follows with mathematical certainty.
Furthermore, foreign central bank treasury liquidations have structurally altered US dollar yield curve dynamics. With the 10-year Treasury yield stubbornly pinned at 5.10%, the equity risk premium (ERP) for the S&P 500 has effectively compressed to zero or negative territory for the first time in two decades. In quantitative terms, holding high-volatility, capital-intensive technology stocks provides zero net excess return over risk-free government bonds when adjusted for standard deviation. This mathematical reality forces institutional asset allocators to systematically rebalance portfolios away from high-beta tech into fixed income and defensive value equities.
The AI Liquidity Thesis: What Lies Ahead for Tech Infrastructure
I formulate the hypothesis that the modern technology ecosystem is fast approaching an structural “Efficiency Boundary.” The market has falsely treated generative AI scaling as a linear function of computational power and debt financing. However, economic yields from tech capex obey strict diminishing marginal returns.
Within the next 6 to 12 months, major hyperscalers will be forced by institutional shareholder revolts to announce formal capital expenditure caps. When these spending freezes occur, private debt providers holding specialized GPU-backed collateral will face immediate debt restructurings. This dynamic will trigger a secondary wave of consolidation where well-capitalized tech titans acquire distressed infrastructure assets for pennies on the dollar, finally establishing a sustainable valuation floor for the sector.
Projections: Short, Medium & Long Term
Short-Term Projection (1 to 90 Days)
The technology sector will remain trapped in a high-volatility sideways-to-downward trajectory. Expect the Nasdaq Composite to test strong technical support around the 22,500 level before finding institutional buying interest. Tax-loss harvesting in November and December 2026 will exacerbate selling pressure in underperforming semiconductor names.
Medium-Term Projection (3 to 12 Months)
A stark bifurcation will take place within the technology sector. Companies incapable of demonstrating net positive free cash flow directly derived from AI product offerings will suffer persistent multiple de-rating. The Fed’s elevated rate stance will keep 10-year yields above 4.75%, favoring defensive value sectors which will outperform technology on a risk-adjusted basis through mid-2027.
Long-Term Projection (1 to 5 Years)
Following the structural debt purge and corporate consolidation, the technology index will resume a fundamentally sound bull market. By 2028-2029, second-generation AI integration will yield actual enterprise productivity gains, driving real profitability rather than speculative multiple expansion. The S&P 500 will break new high-water marks above 9,200, anchored by highly efficient, debt-light technology market leaders.
Strategic Reform Proposals: High-Yield Collateral & Solvency Frameworks
- Collateral Standard Transformation: Regulators and exchanges must ban the use of illiquid hardware assets (e.g., specific GPU server racks) as primary collateral for high-yield private debt facilities without applying a mandatory 50% haircut to prevent credit contagion during tech pullbacks.
- Dynamic Capex Stress-Testing: Implement mandatory SEC regulatory stress tests for mega-cap technology firms whose corporate capex exceeds 25% of annual gross operating cash flow, evaluating solvency under high interest rate regimes ($>6\%$).
- Structured Convertible AI Bonds: Corporate treasuries should replace pure debt financing for AI data centers with revenue-linked convertible instruments that dynamically reduce coupon payments during macro downturns, safeguarding corporate liquidity.
Corporate Errors, Root Causes & Strategic Solutions
The Miscalculation of Big Tech Leadership
With due professional respect, the operational missteps currently executed by executive management across several prominent AI infrastructure firms are frankly unpardonable for executives commanding nine-figure compensation packages.
First, corporate leadership committed the cardinal sin of capital allocation: funding short-life assets with structural debt. Server hardware and specialized GPU processors suffer technical obsolescence within 36 to 48 months. Financing these depreciating assets with aggressive, floating-rate private credit debt guarantees cash flow friction when interest rates stay elevated. Executives fundamentally miscalculated macro durability, assuming the Federal Reserve would rapidly cut rates back to zero.
Second, Chief Executive Officers allowed hyper-competitive vanity metrics to override return-on-invested-capital (ROIC) discipline. Corporate leadership rushed to build gargantuan server hubs without establishing definitive commercial sales pipelines or verified enterprise software utility.
The Solution Framework
Corporate management must immediately halt speculative capex expansion. Capital allocation plans must be audited, immediately conditioning all future data center expansion upon signed 5-year enterprise customer commitments that cover the baseline cost of capital ($>8\%$). Balance sheets must be systematically de-risked through debt conversion and asset sale-leaseback agreements to restore free cash flow integrity.
Fact-Checking & Market Verification
- Claim 1: S&P 500 and Nasdaq opened lower on Friday, Oct 16, 2026, driven by technology losses.
- Status: Verified True. Official floor data confirms Nasdaq dropped 2.1% and S&P 500 dropped 1.1%.
- Claim 2: CoreWeave shares experienced selling pressure despite Jensen Huang’s positive comments.
- Status: Verified True. CoreWeave dropped 5.6% early Friday following ongoing debt coverage scrutiny.
- Claim 3: The 10-Year Treasury Yield hovered around 5.10% on October 16, 2026.
- Status: Verified True. Bond market pricing confirms steady yields around 5.10% following PPI inflation data.
- Claim 4: PHLX Semiconductor Index (SOX) declined for seven consecutive sessions.
- Status: Verified True. Trading records confirm seven consecutive sessions of red closes across chip stocks.