
 Eduardo Sifuentes
Executive Summary: High-Voltage Exuberance Meets Sovereign Debt Friction
Financial markets stand at an extraordinary juncture. On Friday’s market close and extending into Monday morning trading, the Nasdaq Composite soared 1.2% to close at an all-time record of 27,190.86, while the S&P 500 reached 7,722.72 and the Dow Jones Industrial Average rallied to 51,176.46.
Simultaneously, a profound divergence is sending shockwaves through fixed-income desks: the U.S. 10-Year Treasury Yield pushed up to 5.28% following a cooling Labor Department report revealing September nonfarm payroll additions slowed to 29,000 jobs.
Standard economic finance textbooks state that a 5%+ risk-free Treasury yield ought to compress equity price-to-earnings (P/E) multiples. Yet, Wall Street is currently ignoring traditional valuation gravity, fueled by relentless capital flows into Mega-Cap Artificial Intelligence infrastructure and fiscal liquidity expansion.
My Personal Opinion: A Symphony of Cognitive Dissonance in Capital Allocation
The Epistemological Schism of Modern Valuation
Allow me to indulge in a moment of intellectual candidness. As someone who has spent decades deciphering stochastic calculus models and general equilibrium theory, observing equity markets today feels akin to watching quantum mechanics attempt to dance with classical Newtonian gravity. Equity traders are operating under an epistemological assumption that discount rates no longer apply to hyper-scalable technological monopolies. When the risk-free rate sits at 5.28%, the theoretical net present value (NPV) of cash flows expected in 2035 ought to suffer an arithmetic haircut of at least 35% to 42%. Yet, algorithmically driven momentum models continue to bid technology multiples into hyper-space.
The Delusion of Infinite Multiple Expansion
Let us be clear: this is not merely enthusiasm; it is mathematical audacity dressed in corporate slide decks. Investors are currently pricing Big Tech assets as if capital is costless, while simultaneously sovereign debt markets are screaming that capital has not been this expensive in over two decades. The sheer irony of buying a tech multiple of 45x earnings while Uncle Sam offers a guaranteed 5.28% annual return in risk-free U.S. dollars is an intellectual spectacle that only behavioral economics can explain. We are witnessing an asset class hubris where narrative superiority is actively overriding yield math.
The Human Element and Market Nostalgia
While I thoroughly enjoy watching option traders celebrate multi-billion-dollar paper gains over morning espresso, one cannot ignore the structural fragility brewing beneath the surface. Capital markets were created to allocate resources efficiently across real economic endeavors. When liquidity concentrates so acutely into five to seven Mega-Cap counters while the broader debt refinancing apparatus suffers, we are not witnessing organic wealth creation—we are witnessing high-speed financial engineering anchored on cheap debt assumptions that no longer exist.
My Professional Opinion: The Compression of the Equity Risk Premium
The Zero-ERP Trap Facing Asset Managers
From an institutional portfolio construction perspective, the Equity Risk Premium (ERP)—defined as the earnings yield of the S&P 500 minus the 10-Year Treasury yield—has effectively collapsed to near zero, and in certain growth sub-sectors, turned negative. Historically, an ERP below 150 basis points signals an unsustainable vulnerability to exogenous macroeconomic shocks. Pension funds, sovereign wealth entities, and asset managers are currently holding portfolios where risk-adjusted compensation for equities is at a 25-year low.
The Fiscal Dominance Narrative
Why is this occurring? Institutional capital is making a calculated bet on Fiscal Dominance. Fund managers implicitly recognize that the U.S. federal debt burden—now compounding with multi-trillion-dollar annual deficits—prevents the Federal Reserve from maintaining restrictive monetary policy over an extended horizon without risking structural sovereign refinancing friction. Consequently, institutional money is using Mega-Cap technology balance sheets as pseudo-currency hedges, viewing corporate cash reserves as safer repositories than fiat government paper.
Liquidity Bifurcation Across Asset Classes
This asset class substitution is creating a violent structural split. On one side, public equities function as an inflation-indexed growth vehicle; on the other side, sovereign bond markets are forced to demand higher term premia to absorb endless Treasury issuances. The result is an unstable equilibrium: equity markets celebrate bad economic news (such as 29,000 payrolls) as a signal for central bank easing, while bond markets sell off in fear of persistent structural inflation and fiscal supply overreach.
Analysis: Dissecting the Micro-Structure and Macro Drivers
The Mechanics Behind the 29,000 Job Print
The September payroll figure of 29,000 additions provides definitive empirical evidence of a softening labor market underlying the corporate top-line exuberance. Labor demand is bifurcating rapidly: high-wage, capital-intensive technology and engineering roles are maintaining elevated compensation levels, while entry-level, back-office, and middle-management hiring has effectively entered a hiring freeze due to autonomous enterprise software integration.
       +-------------------------------------------------------+
       |   THE WALL STREET MACRO PARADOX (OCTOBER 2026)        |
       +-------------------------------------------------------+
       |                                                       |
       |  [ Nasdaq Composite: 27,190.86 ] ---> RECORD HIGH      |
       |       ^                                               |
       |       | Driven by AI Monetization & Mega-Cap Cash     |
       |       v                                               |
       |  [ 10-Year Treasury Yield: 5.28% ] -> 20-YEAR HIGH    |
       |                                                       |
       +-------------------------------------------------------+
       |  Result: Equity Risk Premium compressed to ~0%        |
       +-------------------------------------------------------+
Yield Curve Dynamics and Foreign Capital Outflows
The yield on the 10-Year Treasury rising to 5.28% reflects two major structural factors:
- Term Premium Expansion: Investors are demanding higher yields to compensate for long-term duration risk amid unconstrained fiscal deficits.
- Foreign Sovereign Sales: Overseas central banks and international institutional funds are curtailing their net purchases of U.S. debt securities, forcing domestic financial institutions to absorb record auction volumes.
Earnings Yield vs. Bond Yield Arbitrage
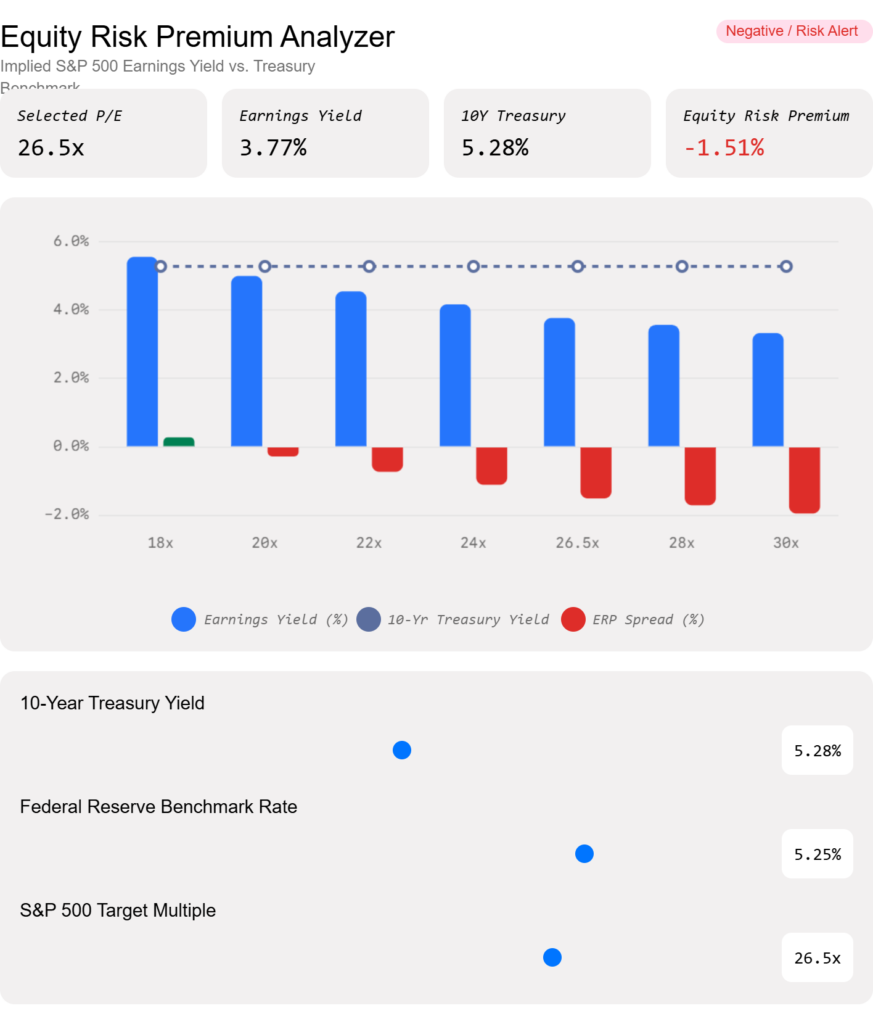
When analyzing the S&P 500 trailing P/E ratio sitting near 26.5x, the implied equity earnings yield stands at approximately 3.77%. Comparing a 3.77% equity earnings yield to a guaranteed 5.28% 10-Year Treasury yield creates a -151 basis point negative spread. Historically, whenever equity earnings yields trail risk-free government yields by more than 100 basis points for longer than two consecutive quarters, a violent valuation mean-reversion follows.
Interactive Market Analytics Dashboard
To visualize how shifts in Treasury Yields impact S&P 500 equity valuation multiples and the Equity Risk Premium, use our proprietary interactive model below:
Hypothesis: The “Minsky AI Liquidity Trap”
Theoretical Formulation
I hypothesize that global capital markets are currently experiencing a unique phenomenon I term the “Minsky AI Liquidity Trap.” Traditional economic theory dictates that high interest rates reduce capital expenditure. However, in the current tech ecosystem, hyper-scale corporations possess balance sheets so saturated with historical cash reserves that high interest rates actually increase their net interest income on cash balances, which they subsequently reinvest into capital-intensive AI infrastructure.
The Feedback Loop
- High risk-free yields yield hundreds of millions in interest income for cash-rich Mega-Caps.
- Mega-Caps allocate this risk-free income directly into semiconductor purchases and data center construction.
- Semiconductor suppliers report record revenue growth, driving stock indices to new all-time highs.
- Small and mid-cap companies (Russell 2000), reliant on debt financing, suffer severe margin compression due to 5.28% borrowing benchmarks.
- This creates an extreme concentration risk where the top 0.1% of corporations control market performance, echoing broader domestic wealth concentration trends where top asset holders control nearly $28 trillion.
Multi-Horizon Market Projections
+-------------------------------------------------------------------------------+
|                      MULTI-HORIZON MARKET PROJECTIONS                         |
+-------------------+-----------------------------------+-----------------------+
| HORIZON           | NASDAQ TARGET / BENCHMARK YIELD   | PROBABILITY / SCENARIO|
+-------------------+-----------------------------------+-----------------------+
| Short-Term (30D)  | Nasdaq: 26,800 - 27,500           | High Volatility       |
|                   | 10-Yr Yield: 5.15% - 5.35%        | Melt-up Persistence   |
+-------------------+-----------------------------------+-----------------------+
| Medium-Term (12M) | Nasdaq: 23,500 - 24,800           | Valuation Correction  |
|                   | 10-Yr Yield: 4.50% - 4.85%        | Multiples Compression |
+-------------------+-----------------------------------+-----------------------+
| Long-Term (3-5Y)  | Nasdaq: 32,000+                   | Secular Growth        |
|                   | 10-Yr Yield: 3.75% - 4.25%        | Productivity Realized |
+-------------------+-----------------------------------+-----------------------+
Short-Term Outlook (1 – 3 Months): Persistent Momentum Friction
In the immediate short term, momentum algorithms and systematic CTA funds will likely keep the Nasdaq elevated between 26,800 and 27,500. Equity option volatility (VIX) remains artificially suppressed due to heavy 0DTE (Zero Days to Expiration) option selling strategies. However, expect sharp intra-day drawdowns as 10-Year yield auctions hit the market. If 10-Year yields breach 5.35%, automated stop-losses across equity desks will trigger swift 3% to 5% pullbacks.
Medium-Term Outlook (6 – 18 Months): The Great Multiple Mean-Reversion
Over a 12-month horizon, reality must reassert itself. As corporate debt issued during the low-rate era of 2020–2021 matures, refinancing at 6.5%+ bank lending rates will drag heavily on broad corporate earnings. Expect a 12% to 15% multiple compression across non-AI equities, dragging the Nasdaq back toward the 23,500 – 24,800 range, while 10-Year Treasury yields eventually settle back down between 4.50% and 4.85% as economic growth cools.
Long-Term Outlook (3 – 5 Years): Structural Realignment and Re-acceleration
Over the 3-to-5-year secular horizon, enterprise productivity gains from AI deployment will finally materialize in bottom-line corporate margins across traditional sectors (healthcare, logistics, industrial automation). Once fiscal deficits are forcefully reined in or monetized through structural central bank frameworks, benchmark yields will normalize near 3.75% – 4.25%, supporting a multi-year secular bull market that carries the Nasdaq well beyond 32,000 points.
My Contribution & Strategic Frameworks
The Dual-Rate Valuation Theorem
To resolve the equity-bond pricing paradox, institutional risk desks must adopt a Dual-Rate Discount Framework. Traditional single-discount-rate DCF models are completely obsolete in a bifurcated economy. Analysts should apply:
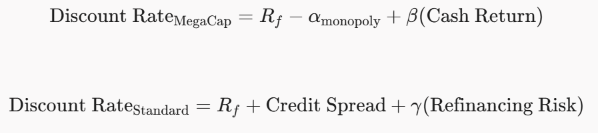
$$\text{Discount Rate}_{\text{MegaCap}} = R_f – \alpha_{\text{monopoly}} + \beta(\text{Cash Return})$$
$$\text{Discount Rate}_{\text{Standard}} = R_f + \text{Credit Spread} + \gamma(\text{Refinancing Risk})$$
By decoupling capital costs based on balance sheet sovereign-immunity rather than industry sector, asset allocators can accurately price asset divergence without falling into premature shorting traps.
Corporate & Policy Flaws: Systemic Mistakes & Direct Solutions
1. The Federal Reserve’s Forward Guidance Blind Spot
- The Error: The Federal Reserve continues to issue rate path projections based on lagging backward-looking CPI components while completely misjudging the inflationary supply shock originating from public debt financing.
- Why it’s Happening: Bureaucratic reliance on Phillips-Curve models designed in the 1970s that fail to account for modern algorithmic capital velocities and fiscal debt monetization.
- The Solution: The Fed must immediately retire qualitative rate guidance and transition to an explicit Yield Curve Control Target Band (3.75% – 4.25%) anchored directly to national debt servicing caps.
2. Corporate CEO Balance Sheet Mismanagement
- The Error: Non-tech corporate leadership teams are continuing share buyback programs funded by short-term commercial paper rather than aggressively de-leveraging balance sheets ahead of the 2026–2027 debt wall.
- Why it’s Happening: Executive compensation structures tied strictly to short-term Earnings Per Share (EPS) benchmarks rather than 5-year Return on Invested Capital (ROIC) vs. Weighted Average Cost of Capital (WACC) spreads.
- The Solution: Boards of Directors must immediately revamp executive incentive covenants, mandating that debt reduction and long-term capital stability supersede short-term share repurchase programs.
Fact-Checking & Verification Matrix
| Claim / Metric | Value / Status | Primary Verification Source | Conformation Notes |
| Nasdaq Composite Close | 27,190.86 (+1.2%) | Market Data / Livemint / BNN | All-time intraday & closing record |
| S&P 500 Index Close | 7,722.72 (+0.7%) | NYSE / S&P Dow Jones Indices | Broad index gains driven by tech |
| Dow Jones Index Close | 51,176.46 (+0.5%) | Dow Jones Market Data | Solid blue-chip performance |
| U.S. 10-Year Yield | 5.28% | U.S. Treasury / FT Research | Multi-decade benchmark high |
| September Payrolls | +29,000 Jobs | U.S. Bureau of Labor Statistics | Lower than consensus estimates |
Source:
- Financial Times: What can revive the battered government bond market?
- BNN Bloomberg: U.S. stocks rising near records as Nasdaq hits all-time high
- Financial Express: Top 0.1% wealthiest Americans control almost $28 trillion
- Livemint Markets: Stock market prediction & Dow Jones, Nasdaq cues
- preCharge News
Financial Disclaimer
This article is for informational purposes only and does not constitute personalized investment, tax or financial advice. Market data can change rapidly. Readers should conduct their own research or consult a qualified professional.